一、概述:
Mysql的explain工具目前还没有Oracle的explain plan工具那么强大,但是结合show profiles工具可以实现相似的效果。show profiles语句用于在当前会话执行的语句的资源使用情况。其具体语法为:
SHOW PROFILE [type [, type] ... ]
    [FOR QUERY n]
    [LIMIT row_count [OFFSET offset]]
type:
    ALL
  | BLOCK IO
  | CONTEXT SWITCHES
  | CPU
  | IPC
  | MEMORY
  | PAGE FAULTS
  | SOURCE
  | SWAPS
提示:
navicat执行mysql查询后,下边的剖析按钮其实就是show profile的结果,比较方便。
二、开启profiling
show variables like '%profil%';
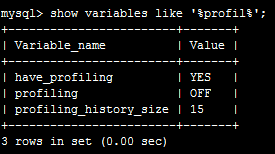
set @@session.profiling=1; --会话级别开启
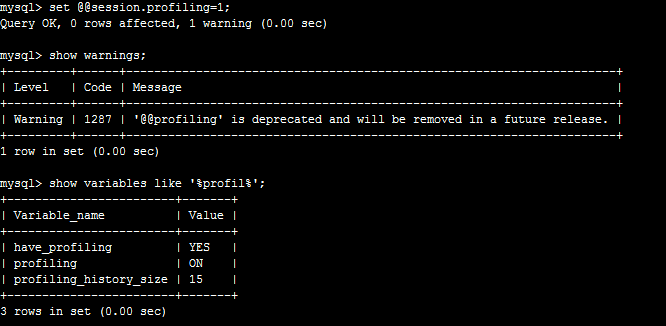
show profiles在Mysql5.6.7之后官方已经不推荐继续使用(deprecated),转而支持performance_schema(感觉老麻烦,还是show profile简单),performance_schema用法详见如下链接:
https://dev.mysql.com/doc/refman/5.6/en/performance-schema-query-profiling.html
三、show profiles的使用
废话不多说,直接3张图说明。(注意:单个query查询用的是show profile不是show profiles)
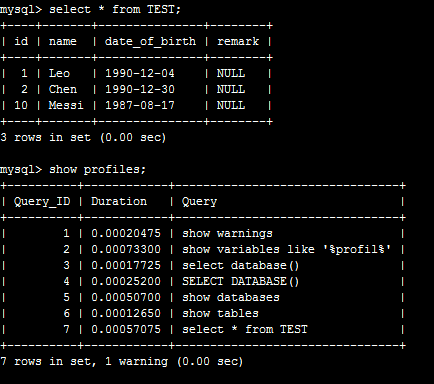
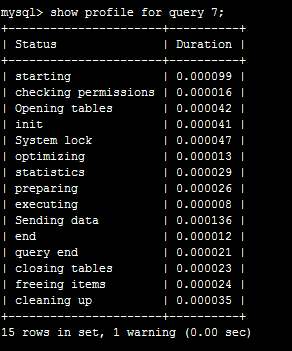
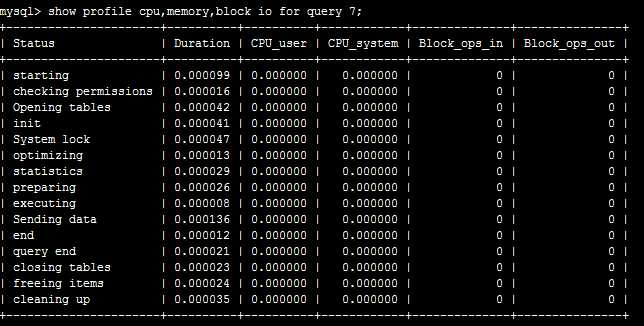
至于图中各个列的解释,官网说明在此:(即infomation_schema.PROFILING表的说明)
QUERY_ID is a numeric statement identifier.
SEQ is a sequence number indicating the display order for rows with the same QUERY_ID value.
STATE is the profiling state to which the row measurements apply.
DURATION indicates how long statement execution remained in the given state, in seconds.
CPU_USER and CPU_SYSTEM indicate user and system CPU use, in seconds.
CONTEXT_VOLUNTARY and CONTEXT_INVOLUNTARY indicate how many voluntary and involuntary context switches occurred.
BLOCK_OPS_IN and BLOCK_OPS_OUT indicate the number of block input and output operations.
MESSAGES_SENT and MESSAGES_RECEIVED indicate the number of communication messages sent and received.
PAGE_FAULTS_MAJOR and PAGE_FAULTS_MINOR indicate the number of major and minor page faults.
SWAPS indicates how many swaps occurred.
SOURCE_FUNCTION, SOURCE_FILE, and SOURCE_LINE provide information indicating where in the source code the profiled state executes.